

DATA VISUALIZATION AND DASHBOARDS: TURN YOUR DATA INTO SMART DECISIONS
Explore the power of your data through visual representations that reveal valuable insights

Strategic Advantages
We solve specific problems. We add value to your company
Clear and Effective Communication
Data visualization turns large volumes of information into clear charts and diagrams, making it easier to understand patterns and trends. This allows companies to make decisions based on accessible and visually appealing information
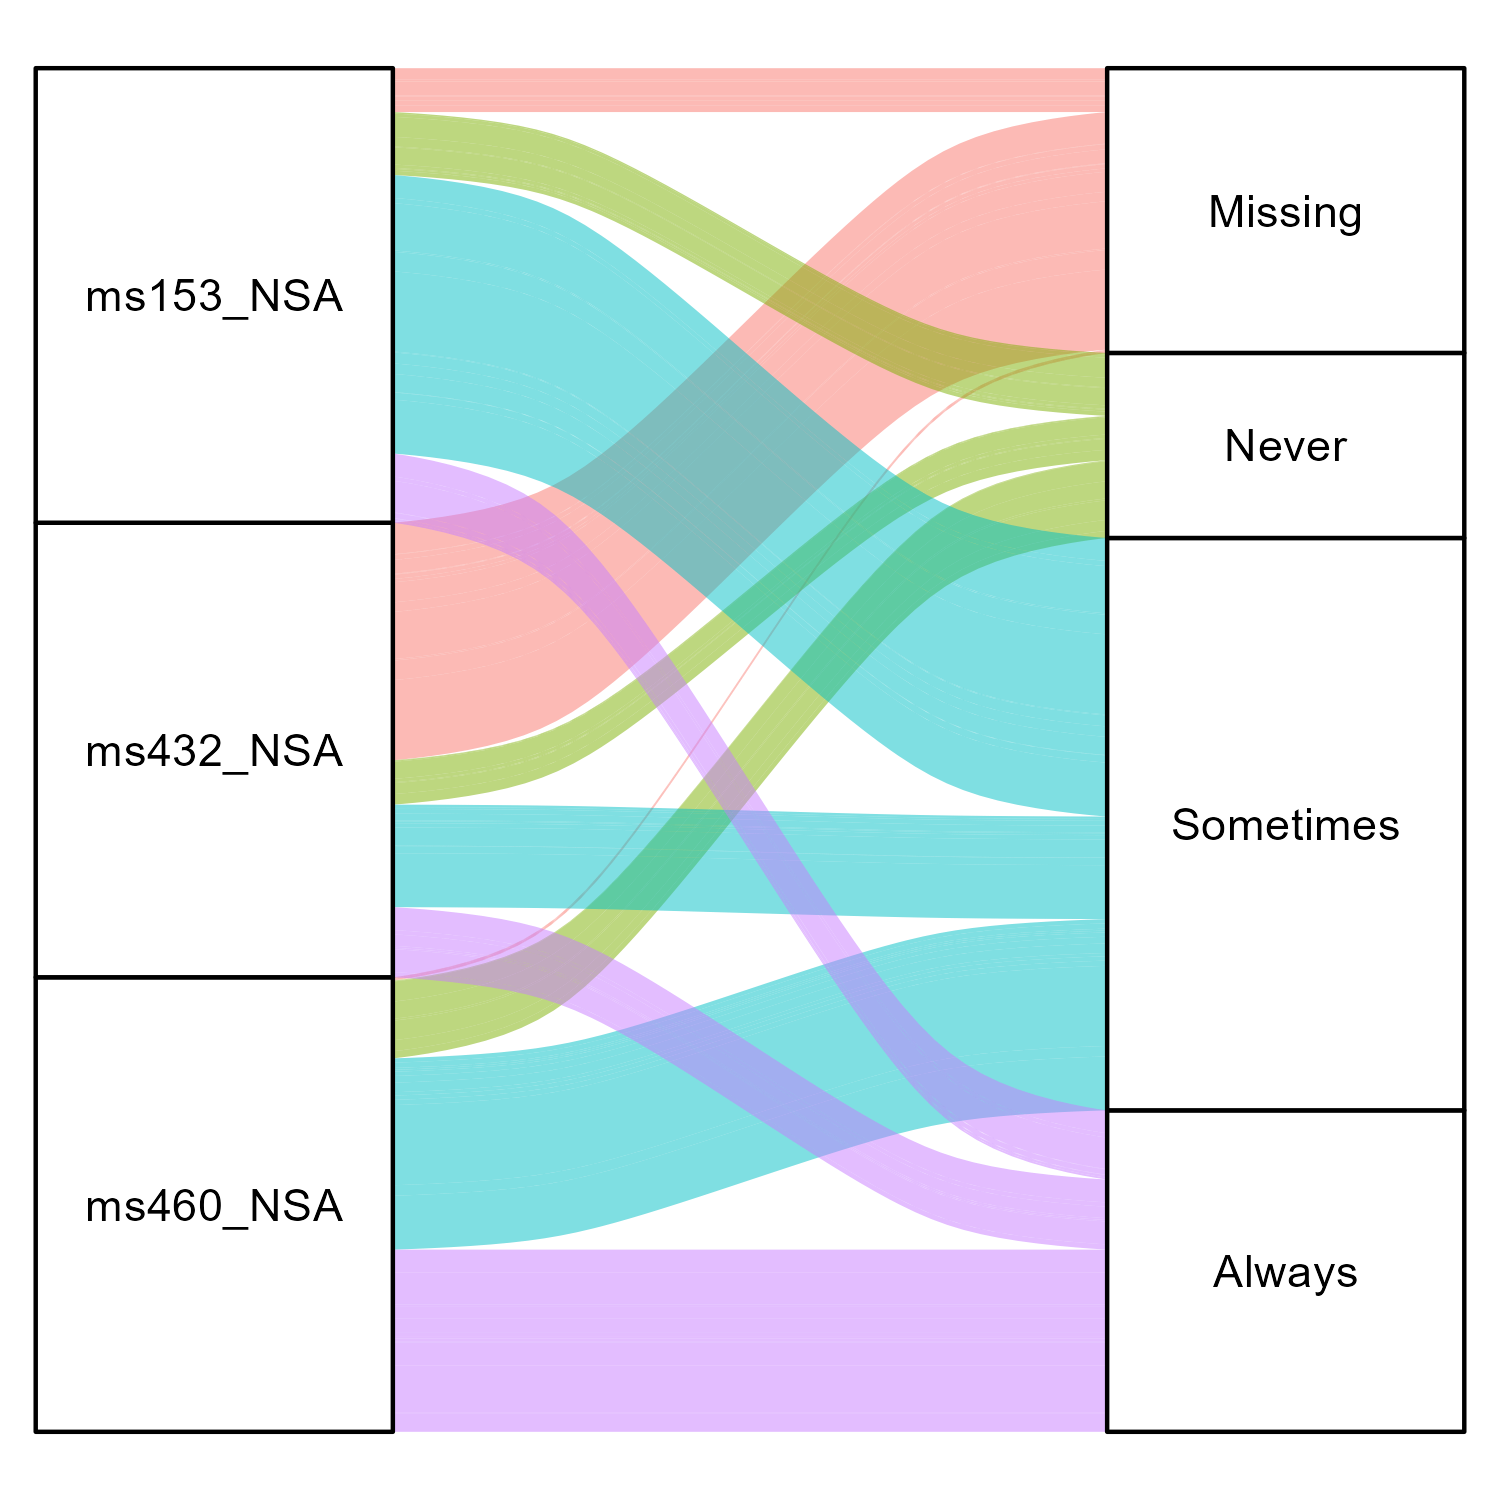
Discovery of Hidden Patterns and Trends
Visualization tools reveal relationships and correlations in data that are not evident in traditional spreadsheets or reports. This helps uncover valuable insights and opportunities for improvement or innovation
Facilitates Quick Decision Making
Interactive visualizations allow decision-makers to explore data in real time and react quickly to any changes, improving business agility
Enhances Collaboration
Graphical data representations make information more understandable for all team members, regardless of their technical level, promoting better collaboration and alignment of goals
Quick Identification of Issues
Visualizations help identify anomalies or problems in data immediately, allowing timely corrective action before they significantly impact the business
Improved Performance and Productivity
By offering an easier way to interpret complex data, time and effort are saved, increasing operational efficiency and allowing resources to focus on areas that generate the most value for the company
Use Cases
Our solutions solve specific challenges and create tangible value across various sectors
KPI Monitoring
Interactive dashboards to visualize company performance in real time
Sales Analysis
Clear visualizations to understand sales patterns and adjust strategies
Project Tracking
Custom dashboards that allow viewing project progress and resource allocation
Executive Presentations
Charts and visualizations that simplify decision-making for senior management
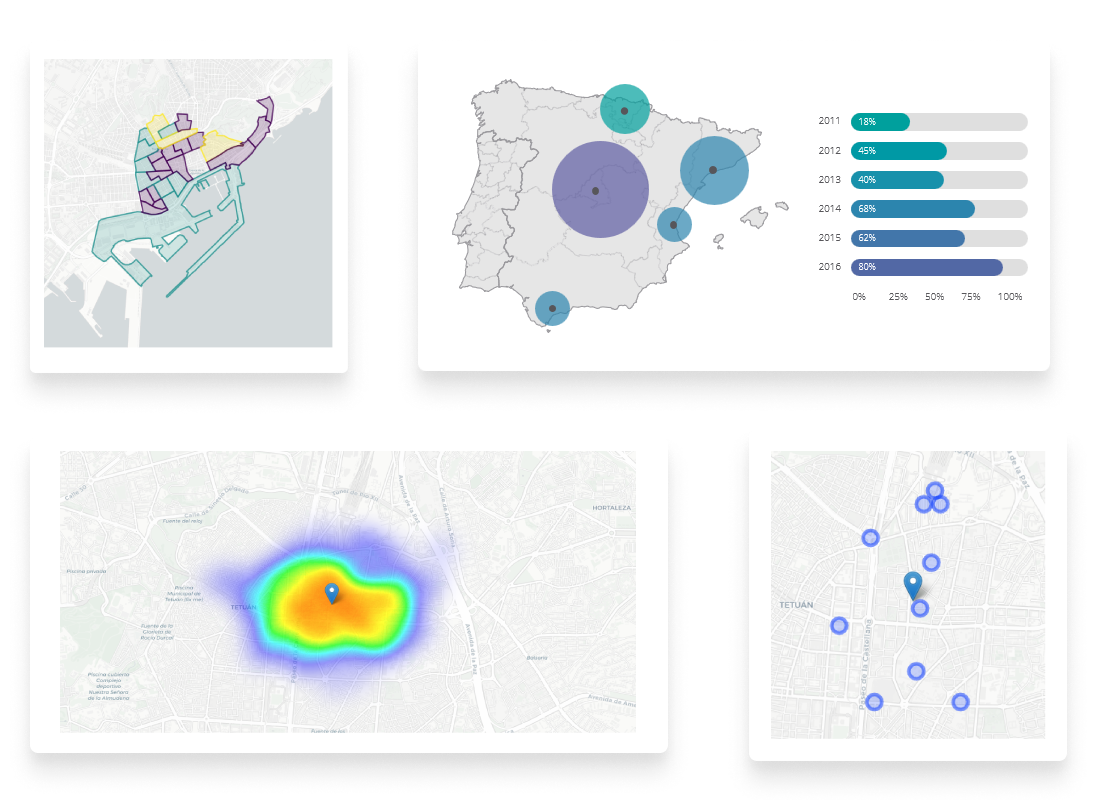
Interactive Data Visualization
We create dynamic charts that allow users to intuitively explore information, providing full control over the data and facilitating real-time interpretation
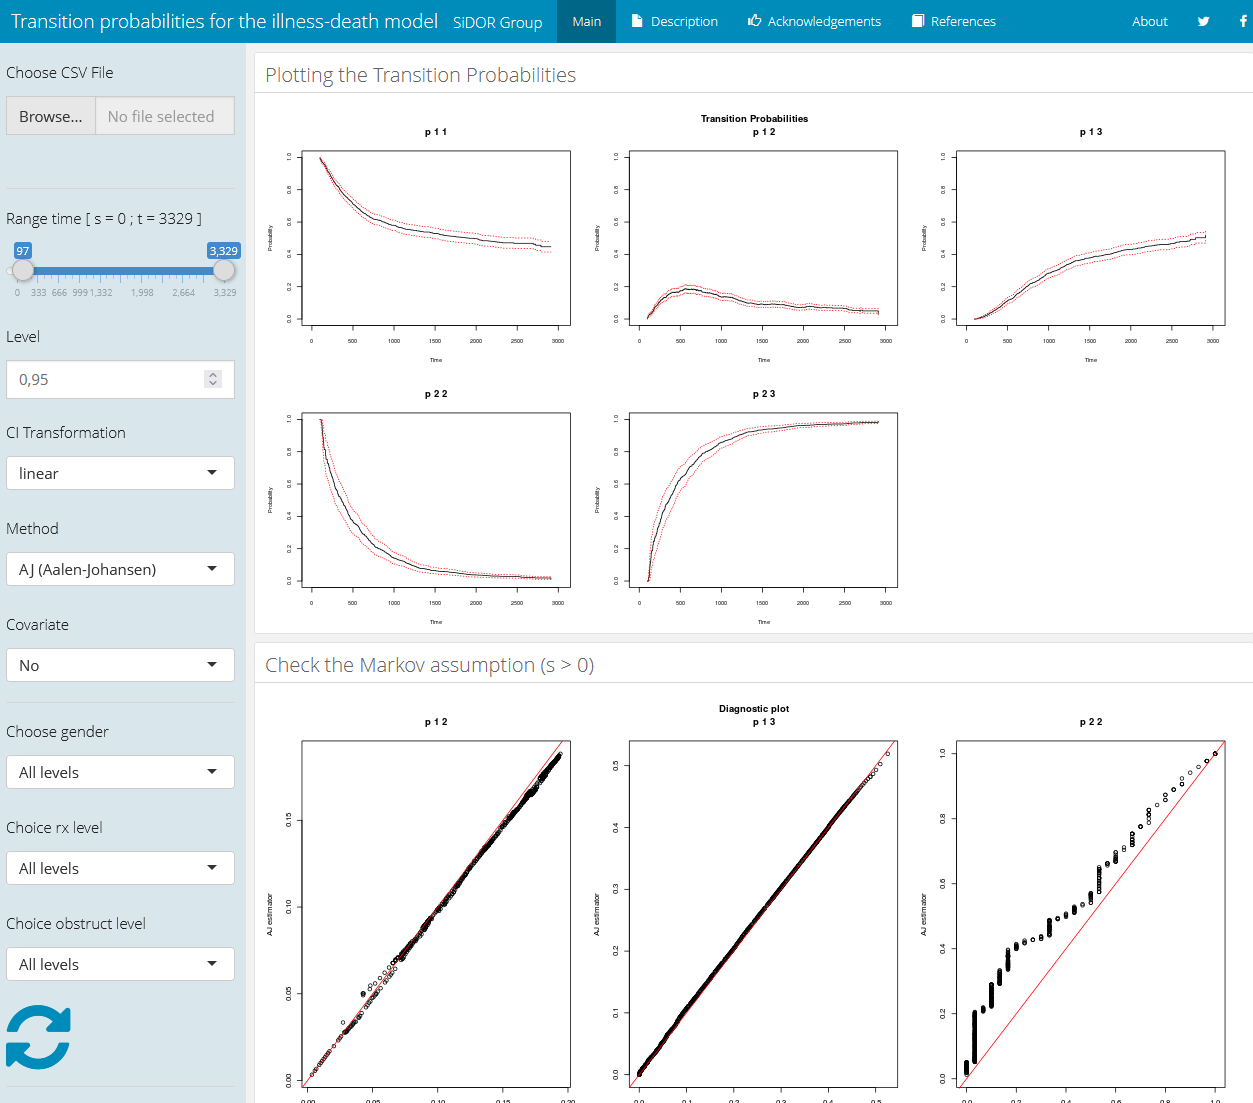
Advanced Chart Generation
We design sophisticated charts that clearly communicate complex information, helping decision-makers visualize trends and hidden patterns
Custom Dashboard Creation
We develop dashboards tailored to each client's needs, centralizing key information and allowing a clear visualization of KPIs and metrics in one place
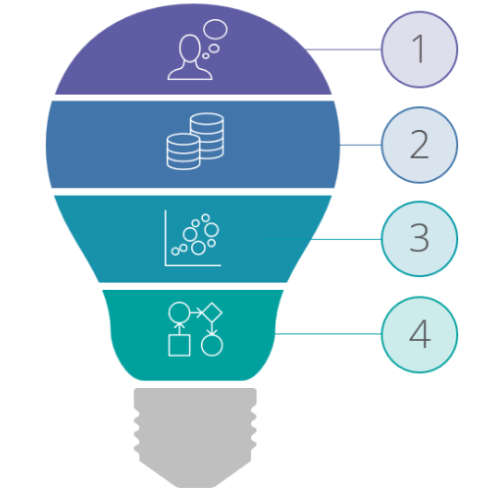
Methodology
Utilizamos procesos rigurosos y sistemáticos, garantizando resultados precisos y adaptados a las necesidades de cada cliente.
1
Defining Objectives and KPIs
We work with the client to determine key objectives and the performance indicators (KPIs) that will be displayed in the visualizations or dashboards to ensure they reflect business goals
2
Data Collection and Source Integration
We gather relevant data from various sources such as databases, APIs, or files, and connect them to the visualization system
3
Designing Visualizations
We create custom visualizations that allow intuitive exploration of data, providing charts, maps, and tables that facilitate analysis
4
Continuous Monitoring and Optimization
We set up real-time updatable dashboards and continuously adjust them to ensure the visualizations always reflect the most relevant and accurate information
Challenges and Solutions
Discover how we tackle complex challenges and offer tailor-made solutions that drive our clients' success

A sales team needed to make real-time decisions but lacked access to updated reports
Solution: We developed an interactive dashboard that integrated sales, inventory, and market trend data in real time. With instant access to this information, the team was able to adjust their sales strategies and improve performance by 25% in just 3 months
Other Services
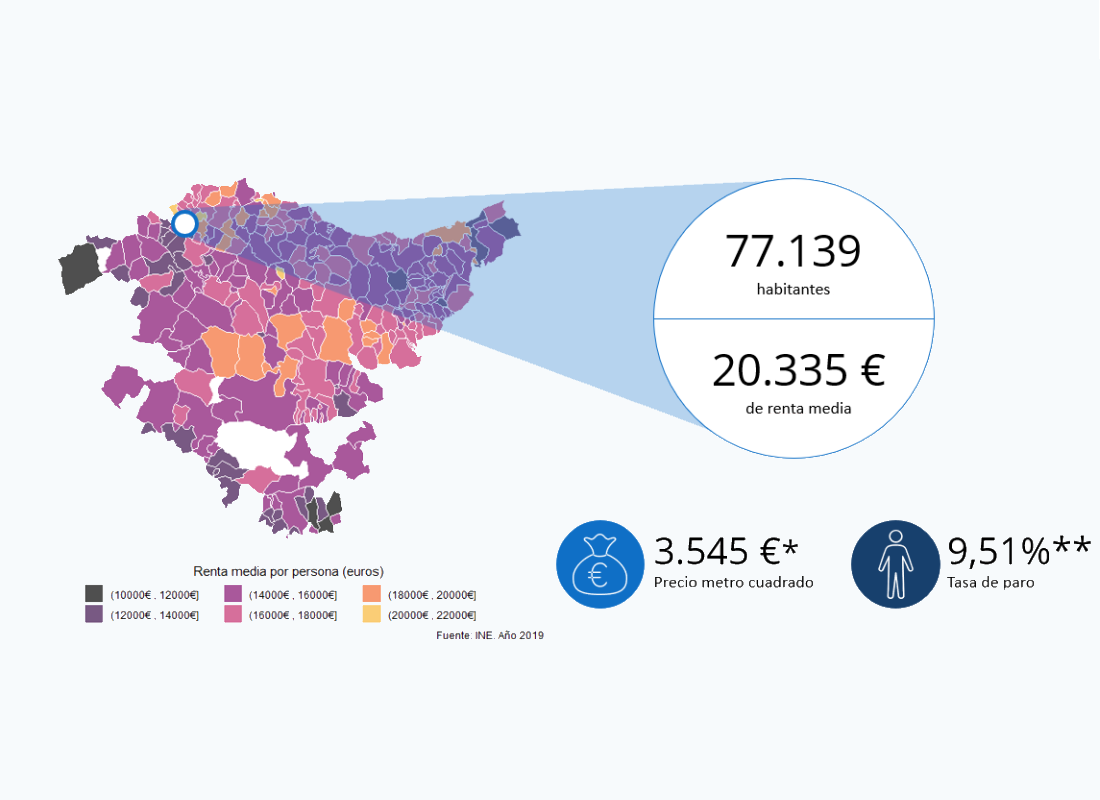
Optimize Strategic Decisions with Business & Location Intelligence
Transform data into actionable insights with our Business Intelligence and Location Intelligence solutions. Leverage valuable insights on your operations and local market to optimize decision-making, improve efficiency, and gain competitive advantages in key locations
Discover New Opportunities with Accurate Market Research
Gain detailed insights into market trends, consumer preferences, and the competitive landscape. Our market research helps you identify key opportunities, reduce risks in new launches, and strengthen your business strategy with solid and reliable data
Tailored Solutions to Boost Your Business
Every business faces unique challenges. Our personalized consulting offers strategies tailored to your needs, using detailed analysis and experience across various sectors to improve performance, optimize processes, and ensure long-term success